MatplotlibChartWithToolbar
Composite control that combines a MatplotlibChart with a ready-made toolbar UI.
Warning
This control requires the matplotlib
Python package to be installed.
See this installation guide for more information.
Inherits: Column
Properties
figure- Matplotlib figure to draw - an instance ofmatplotlib.figure.Figure.
Methods
builddownload_click- Export the figure in the selected format and prompt user to save it.on_message- Show status text produced by the underlying chart toolbar backend.on_toolbar_update- Synchronize back/forward button enabled state with chart history.pan_click- Toggle pan mode and ensure zoom mode is turned off.zoom_click- Toggle zoom mode and ensure pan mode is turned off.
Examples
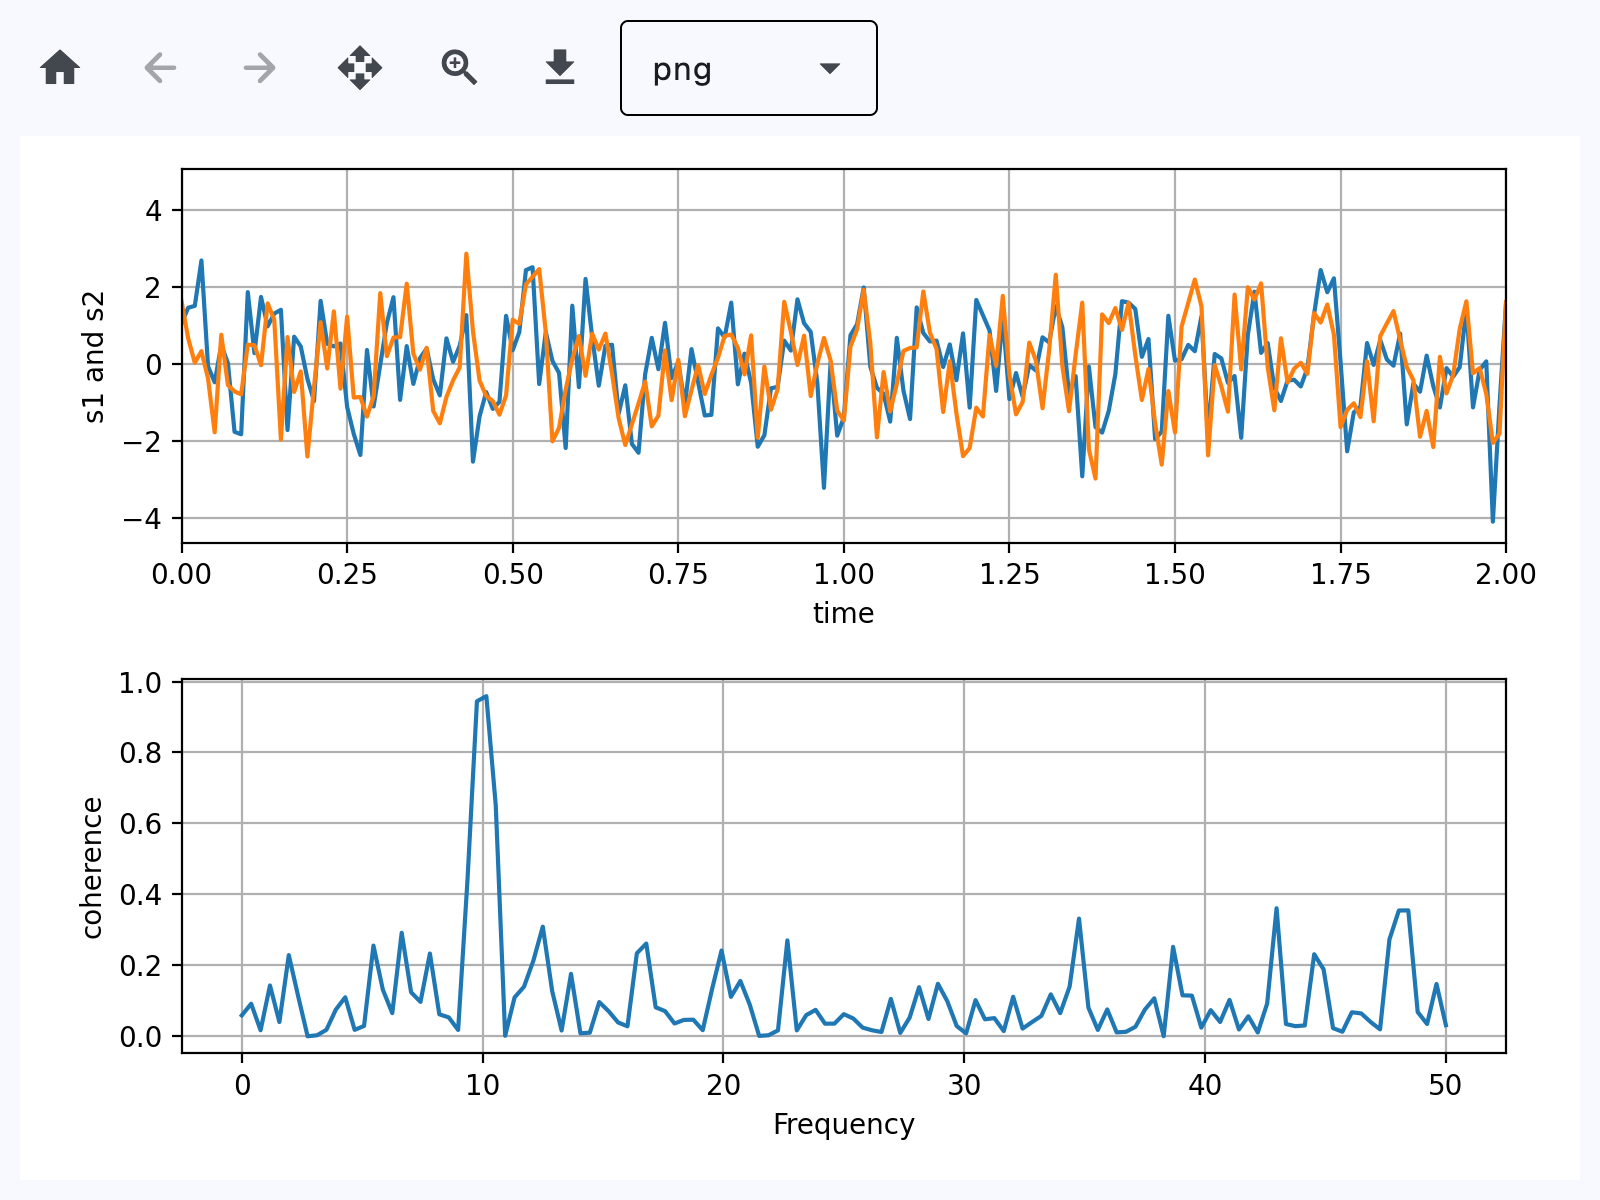
Basic
Based on an official Matplotlib example.
play_arrowTry Online
import matplotlib.pyplot as plt
import numpy as np

import flet as ft
import flet_charts as fch


def main(page: ft.Page):
    # Fixing random state for reproducibility
    np.random.seed(19680801)

    dt = 0.01
    t = np.arange(0, 30, dt)
    nse1 = np.random.randn(len(t))  # white noise 1
    nse2 = np.random.randn(len(t))  # white noise 2

    # Two signals with a coherent part at 10Hz and a random part
    s1 = np.sin(2 * np.pi * 10 * t) + nse1
    s2 = np.sin(2 * np.pi * 10 * t) + nse2

    fig, axs = plt.subplots(2, 1)
    axs[0].plot(t, s1, t, s2)
    axs[0].set_xlim(0, 2)
    axs[0].set_xlabel("time")
    axs[0].set_ylabel("s1 and s2")
    axs[0].grid(True)

    cxy, f = axs[1].cohere(s1, s2, 256, 1.0 / dt)
    axs[1].set_ylabel("coherence")

    fig.tight_layout()

    page.add(
        ft.SafeArea(
            expand=True,
            content=fch.MatplotlibChartWithToolbar(figure=fig, expand=True),
        )
    )


if __name__ == "__main__":
    ft.run(main)
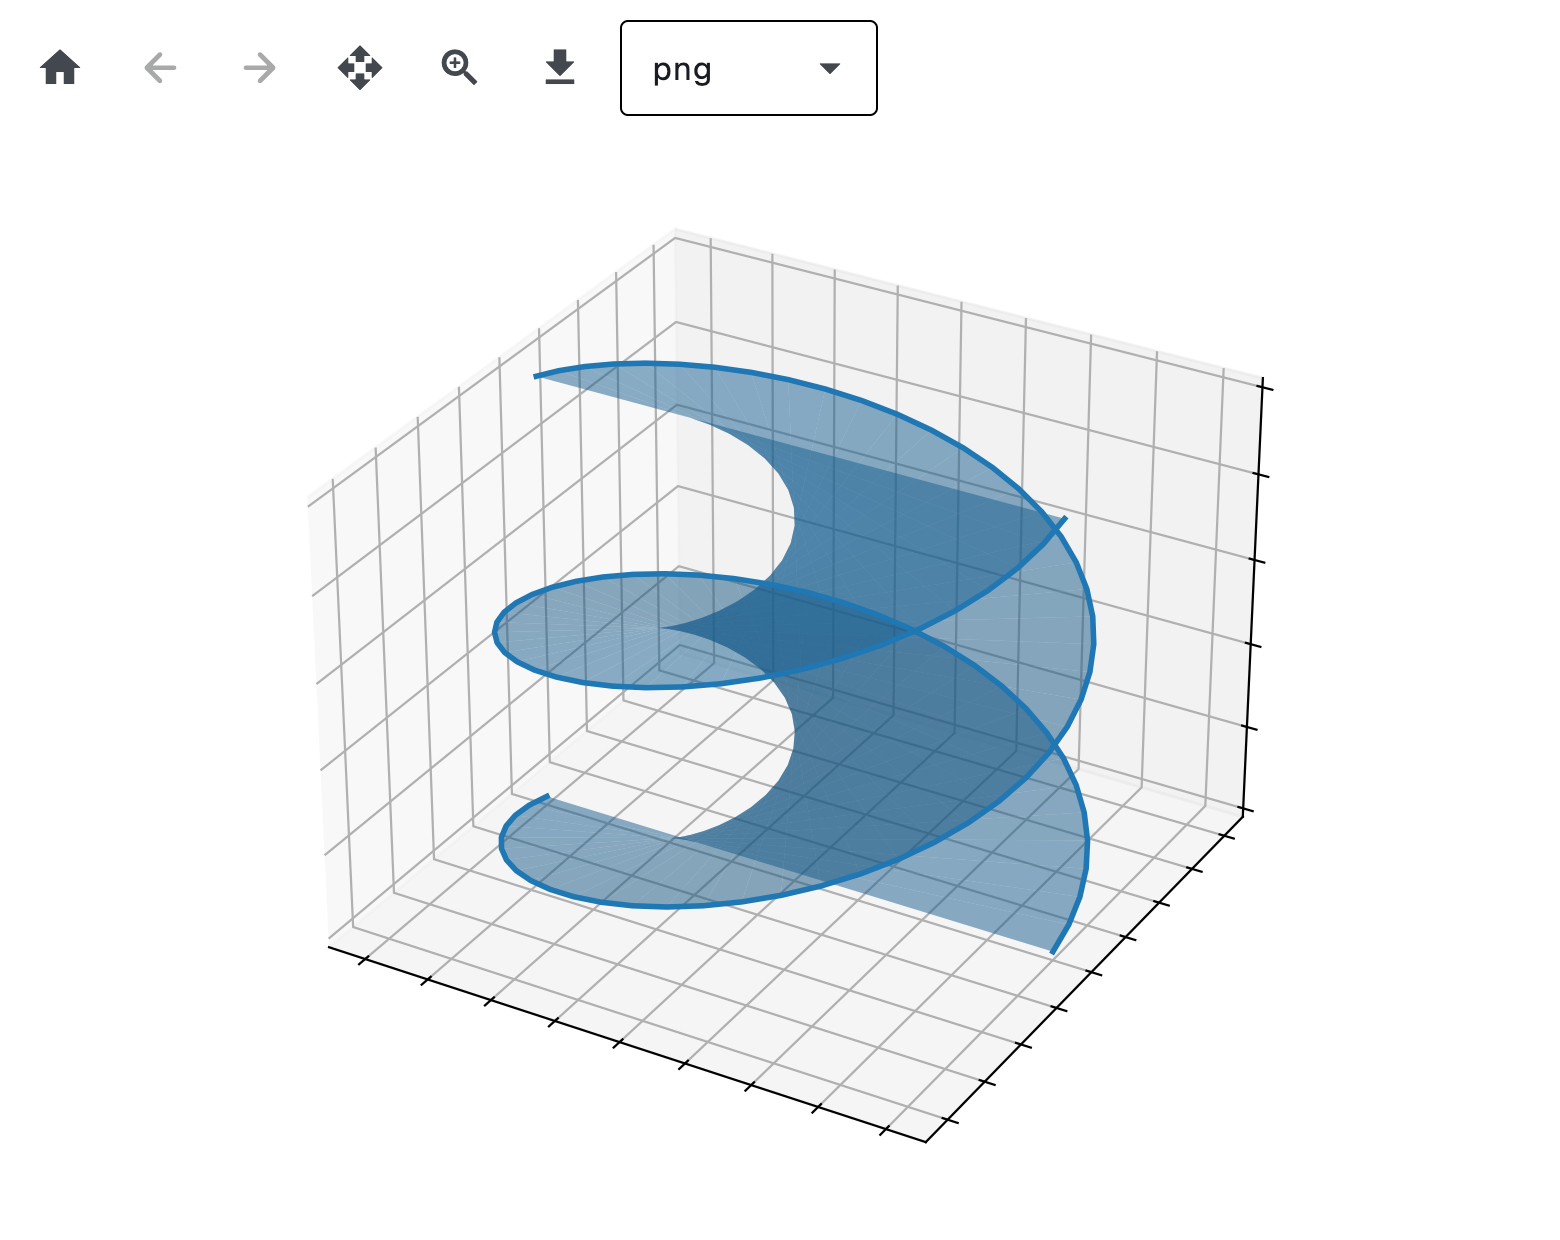
3D chart
play_arrowTry Online
import logging

import matplotlib.pyplot as plt

import flet as ft
import flet_charts

logging.basicConfig(level=logging.INFO)


def main(page: ft.Page):
    from mpl_toolkits.mplot3d import axes3d

    fig = plt.figure()
    ax = fig.add_subplot(projection="3d")
    X, Y, Z = axes3d.get_test_data(0.1)

    # Plot the 3D surface
    ax.plot_surface(
        X, Y, Z, edgecolor="royalblue", lw=0.5, rstride=8, cstride=8, alpha=0.3
    )

    # Plot projections of the contours for each dimension.  By choosing offsets
    # that match the appropriate axes limits, the projected contours will sit on
    # the 'walls' of the graph
    ax.contourf(X, Y, Z, zdir="z", offset=-100, cmap="coolwarm")
    ax.contourf(X, Y, Z, zdir="x", offset=-40, cmap="coolwarm")
    ax.contourf(X, Y, Z, zdir="y", offset=40, cmap="coolwarm")

    ax.set(
        xlim=(-40, 40),
        ylim=(-40, 40),
        zlim=(-100, 100),
        xlabel="X",
        ylabel="Y",
        zlabel="Z",
    )

    page.add(
        ft.SafeArea(
            content=flet_charts.MatplotlibChartWithToolbar(figure=fig, expand=True),
            expand=True,
        )
    )


if __name__ == "__main__":
    ft.run(main)
Handle events
play_arrowTry Online
import matplotlib.pyplot as plt
import numpy as np

import flet as ft
import flet_charts as fch

state = {}


def main(page: ft.Page):
    # Fixing random state for reproducibility
    np.random.seed(19680801)

    X = np.random.rand(100, 200)
    xs = np.mean(X, axis=1)
    ys = np.std(X, axis=1)

    fig, (ax, ax2) = plt.subplots(2, 1)
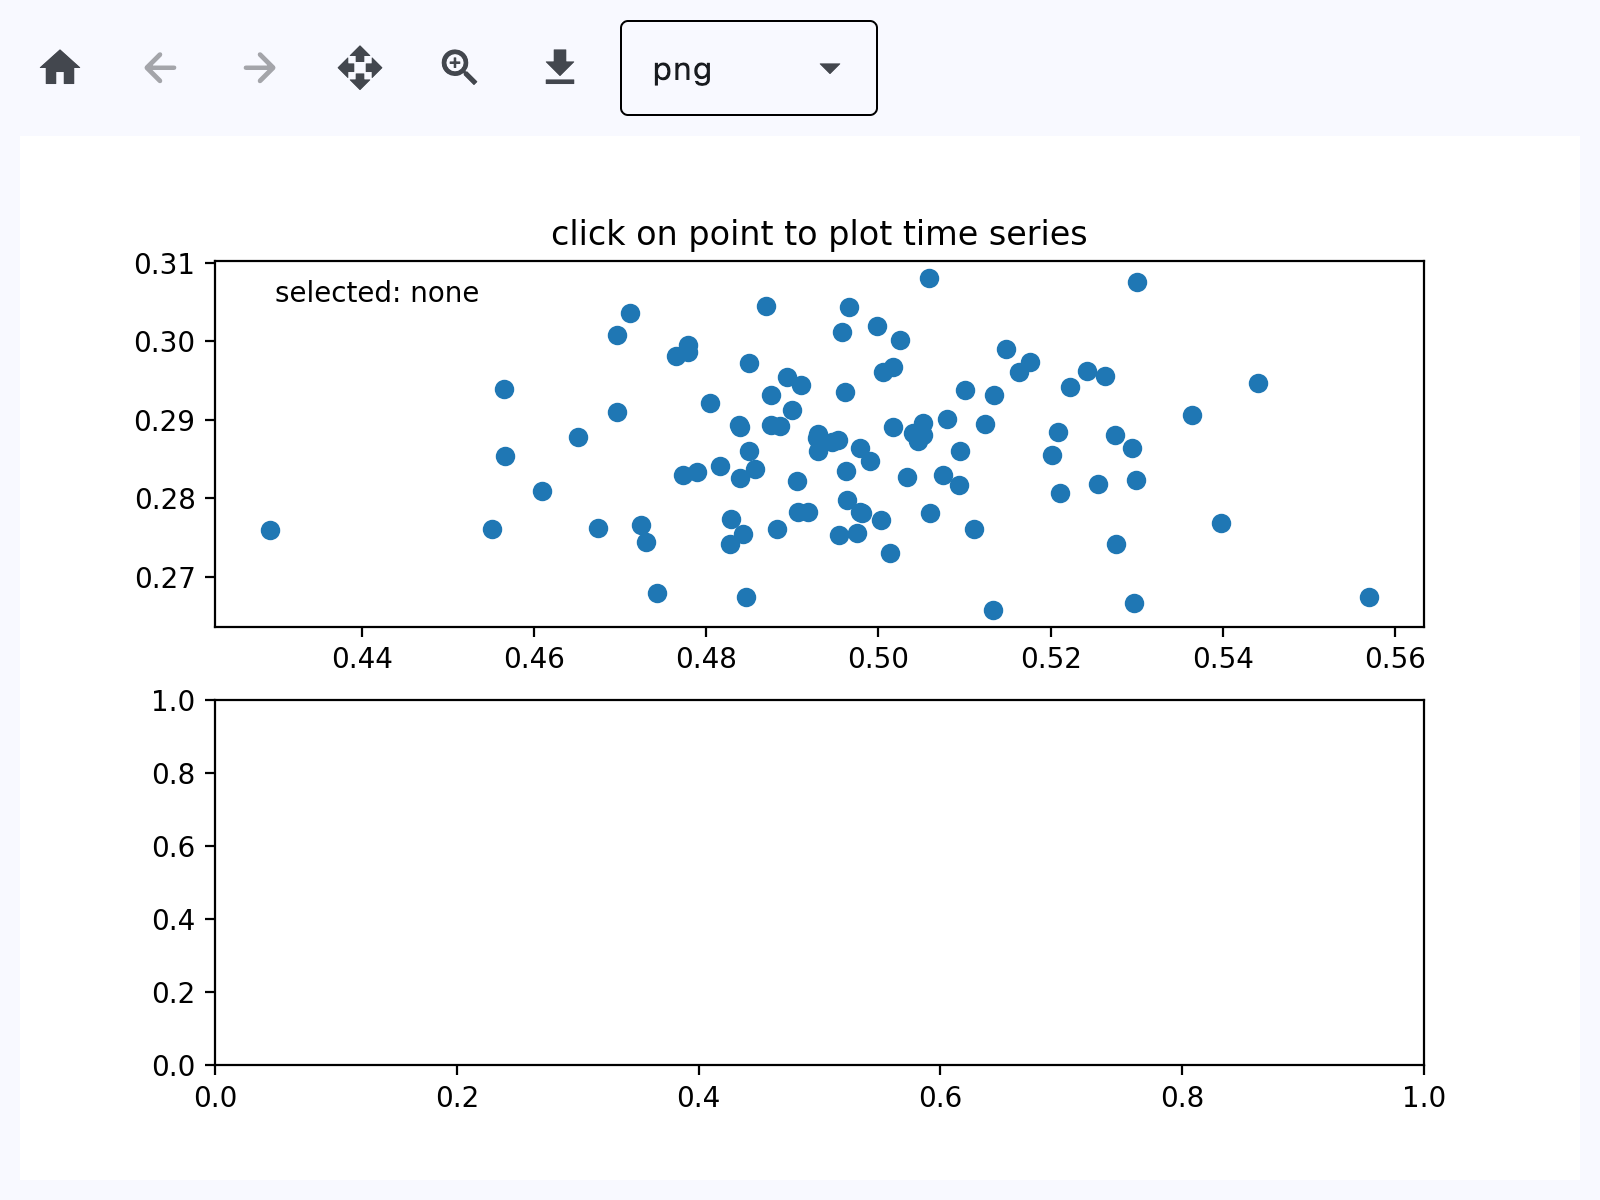
    ax.set_title("click on point to plot time series")
    (line,) = ax.plot(xs, ys, "o", picker=True, pickradius=5)

    class PointBrowser:
        """
        Click on a point to select and highlight it -- the data that
        generated the point will be shown in the lower Axes.  Use the 'n'
        and 'p' keys to browse through the next and previous points
        """

        def __init__(self):
            self.lastind = 0

            self.text = ax.text(
                0.05, 0.95, "selected: none", transform=ax.transAxes, va="top"
            )
            (self.selected,) = ax.plot(
                [xs[0]], [ys[0]], "o", ms=12, alpha=0.4, color="yellow", visible=False
            )

        def on_press(self, event):
            if self.lastind is None:
                return
            if event.key not in ("n", "p"):
                return
            inc = 1 if event.key == "n" else -1

            self.lastind += inc
            self.lastind = np.clip(self.lastind, 0, len(xs) - 1)
            self.update()

        def on_pick(self, event):
            if event.artist != line:
                return True

            N = len(event.ind)
            if not N:
                return True

            # the click locations
            x = event.mouseevent.xdata
            y = event.mouseevent.ydata

            distances = np.hypot(x - xs[event.ind], y - ys[event.ind])
            indmin = distances.argmin()
            dataind = event.ind[indmin]

            self.lastind = dataind
            self.update()

        def update(self):
            if self.lastind is None:
                return

            dataind = self.lastind

            ax2.clear()
            ax2.plot(X[dataind])

            ax2.text(
                0.05,
                0.9,
                f"mu={xs[dataind]:1.3f}\nsigma={ys[dataind]:1.3f}",
                transform=ax2.transAxes,
                va="top",
            )
            ax2.set_ylim(-0.5, 1.5)
            self.selected.set_visible(True)
            self.selected.set_data([xs[dataind]], [ys[dataind]])

            self.text.set_text(f"selected: {dataind:d}")
            fig.canvas.draw()

    browser = PointBrowser()
    state["browser"] = browser

    fig.canvas.mpl_connect("pick_event", browser.on_pick)
    fig.canvas.mpl_connect("key_press_event", browser.on_press)

    # plt.show()

    page.add(
        ft.SafeArea(
            expand=True,
            content=fch.MatplotlibChartWithToolbar(figure=fig, expand=True),
        )
    )


if __name__ == "__main__":
    ft.run(main)
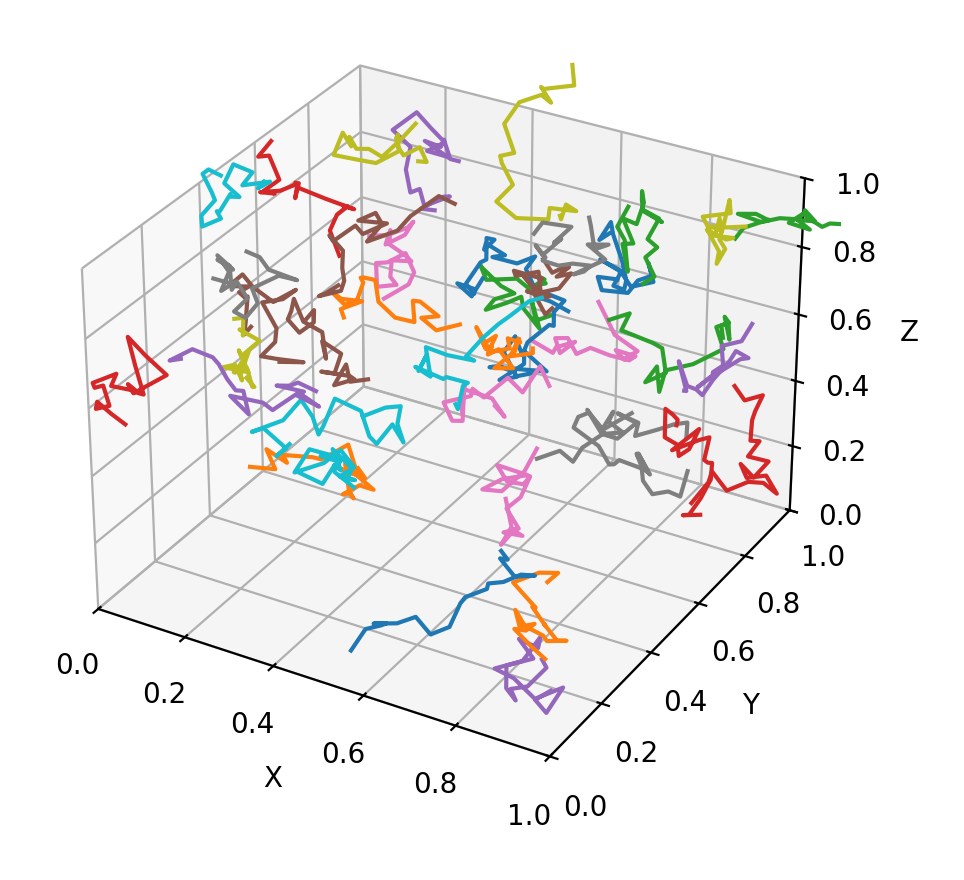
Animated chart
play_arrowTry Online
import logging

import matplotlib.pyplot as plt
import numpy as np

import flet as ft
import flet_charts

logging.basicConfig(level=logging.INFO)

state = {}


def main(page: ft.Page):
    import matplotlib.animation as animation

    # Fixing random state for reproducibility
    np.random.seed(19680801)

    def random_walk(num_steps, max_step=0.05):
        """Return a 3D random walk as (num_steps, 3) array."""
        start_pos = np.random.random(3)
        steps = np.random.uniform(-max_step, max_step, size=(num_steps, 3))
        walk = start_pos + np.cumsum(steps, axis=0)
        return walk

    def update_lines(num, walks, lines):
        for line, walk in zip(lines, walks):
            line.set_data_3d(walk[:num, :].T)
        return lines

    # Data: 40 random walks as (num_steps, 3) arrays
    num_steps = 30
    walks = [random_walk(num_steps) for index in range(40)]

    # Attaching 3D axis to the figure
    fig = plt.figure()
    ax = fig.add_subplot(projection="3d")

    # Create lines initially without data
    lines = [ax.plot([], [], [])[0] for _ in walks]

    # Setting the Axes properties
    ax.set(xlim3d=(0, 1), xlabel="X")
    ax.set(ylim3d=(0, 1), ylabel="Y")
    ax.set(zlim3d=(0, 1), zlabel="Z")

    # Creating the Animation object
    state["anim"] = animation.FuncAnimation(
        fig, update_lines, num_steps, fargs=(walks, lines), interval=100
    )

    page.add(
        ft.SafeArea(
            expand=True,
            content=flet_charts.MatplotlibChartWithToolbar(figure=fig, expand=True),
        )
    )


if __name__ == "__main__":
    ft.run(main)
Properties
figureclass-attributeinstance-attribute
figure: Figure = field(metadata={'skip': True})Matplotlib figure to draw - an instance of
matplotlib.figure.Figure.
Methods
build
build()download_clickasync
download_click()Export the figure in the selected format and prompt user to save it.
on_message
on_message(e: flet_charts.MatplotlibChartMessageEvent)Show status text produced by the underlying chart toolbar backend.
Parameters:
- e (flet_charts.MatplotlibChartMessageEvent) - Message event emitted by
MatplotlibChart.
on_toolbar_update
on_toolbar_update(
    e: flet_charts.MatplotlibChartToolbarButtonsUpdateEvent,
)
Synchronize back/forward button enabled state with chart history.
Parameters:
- e (flet_charts.MatplotlibChartToolbarButtonsUpdateEvent) - Toolbar state update event from
MatplotlibChart.